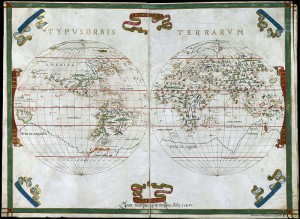
photo credit: Biblioteca Nacional de España via photopin cc
With the commoditization of GPS chips, location analytics, geospatial analysis and location intelligence have become desired features in business intelligence solutions. Everyone and everything that is mobile can be tracked. Location data is easier than ever to capture and store: including a map on a dashboard or in a workspace report is a great way to offer it up for analysis by business users. Maps add visual interest and present data in a familiar, easy to interpret format, as everyone knows how to read a map. Maps are not limited to geographic boundaries such as city, province or country: any kind of data identified by a location be it on a world map or the interior of an airplane can be rendered. Maps are very compelling during demos as they help craft a relatable story that unveils the value of data and business intelligence software.
- IBM Cognos 10 documentation for using maps inside Report Studio
- IBM DeveloperWorks Report Studio Workshop – Maps (written for Cognos 8 but it works the same way with Cognos 10)
- IBM Cognos Map Manager
- IBM DeveloperWorks Integrate Google Maps with Cognos 8 (again, written for Cognos 8 but it works the same way with Cognos 10)
- Sample JavaScript code from IBM for Google Maps integration
- Another example demonstrating the use of the Google Maps API